
The syslog protocol, it's one of the ancient protocols in the Unix world. For a long time the logging was handled by daemons like syslog-ng and rsyslog, this has now been taken over by journald on a lot of systems. But have you ever wondered how your log messages even end up in /var/log in the first place?
I've started looking into syslog implementations when building a replacement for the use of busybox syslogd in postmarketOS. In postmarketOS this daemon is configured to just send syslog messages to a in-memory buffer for logging and never store anything on disk in /var/log. This is mainly to make sure there's no unneeded writes to the flash storage in a lot of the old phones that are supported by postmarketOS. There's a few downsides to this logging implementation though:
- No persistent logging of system messages across reboots. This would be easy to check if certain log messages were present on earlier boots when debugging.
- Completely unstructured logs while people are pretty much used to journald logging with nice filters
As a replacement I wrote logbookd. It's a tiny syslog daemon that supports disk and memory logging and provides some nice filtering options to be closer to journald. The bulk of this work is handled by doing structured logging into SQLite.
So how does the syslog work
The way the syslog works is incredibly simple. The syslog daemon opens an unix domain socket at /dev/log. Applications connect to this socket and write log messages in the syslog format and the syslog daemon takes care of filtering those out and putting it in the various files in /var/log.
The complication of this is that there is no real syslog protocol. There are two standards for it though. There is RFC 3164 and RFC 5424 which both describe the syslog protocol. The 3164 document was only created in 2001 and describes what various implementations are doing in the wild. It's RFC 5424 that actually nails down a specific format.
I wrote parser for the 5424 format initially since that's the newest standard and it's by far the easiest to parse. An RFC 5424 log message looks like this:
<13>1 2023-12-11T14:56:59.0189+01:00 laptop test - - [timeQuality tzKnown="1"] HiThe first part here between the angular brackets is the PRI value. It encodes the logging facility and severity as one number. The least significant 3 bits encode the severity on a scale of 1-8 and the other bits encode one of the 23 facilities that are defined. Some examples of the facilities are:
0for kernel messages1for generic userspace messages2for the mail system
Most of the other numbers are for more old services like UUCP and FTP and for some numbered user-defined codes. In the example above the 13 means facility 1 (user) and severity 5 (notice).
The other parts of this message are in order:
- The protocol version number which is set to
1here. - A timestamp with timezone for the log message
- The
laptopis the hostname for the message, this will be set to-when NULL - The
testpart is the application name. This can also be-for NULL - The next field is called PROCID and is set to
-for NULL in my case. According to the standard it might be used for the pid but is mostly implementation defined. - The second null is the MSGID, it can define a message type from the specific service, it will also be null in most cases.
- The next part is
[timeQuality tzKnown="1"]which is the STRUCTURED-DATA field. It can contain any implementation defined data. This is a subset of the structured data created by theloggertool used to create test messages. This field can also be just-for no structured data. - Finally the actual log message. That's just
Hiin this case.
Writing a parser for this format is relatively straightforward. In the logbookd implementation there's a row for every one of these fields in the logging table and the message is split up according to these rules.
There is a fatal flaw in the RFC 5424 specification though: nobody is using it. None of the log messages on my running systems are actually in this format. It looks like practically all software uses RFC 3164, which is a fancy way of saying they do whatever they want.
RFC 3164
So this is actually the true specification for syslog messages being used in the wild. Let's look at one of these messages:
<13>Dec 11 15:21:50 laptop test: HiIt's a lot simpler! But not actually. This is a pretty minimal message. The initial part is the same as the RFC 5424 message, the PRI is luckily parsed the exact same way. There is no version indicator though and it does not use an ISO timestamp format.
The more problematic issues with this format though is that it does support a lot more data but it's pretty badly defined. Even all the parts shown in the example above are optional. The most minimal syslog message that is still up to this spec is Hi.
It's also somewhat valid to send messages with a badly formatted timestamp and it's up to the syslogd to fix up the timestamp in the message. This also makes it very easy to make it actually parse parts of the timestamp as the hostname since this is all badly defined and space separated.
Since there is no official field for the pid of a process this is usually appended to the application name in square brackets.
The logbookd implementation is mostly based on the way these old messages are parsed in rsyslog and tries to not guess parts. This means only the timestamp, app, hostname and message fields are filled in.
Kernel logging
Not all logging in the system comes from userspace. On Linux there's also the kernel log ringbuffer that can be read from /dev/kmsg. Reading from this file will return all the log messages in the kernel ringbuffer and also makes it possible to stream new log messages with further reads. The log messages from the kernel are in a similar but different format than the syslog socket:
6,1004,5150172365,-;hid-generic 0003: hiddev96,hidraw2: USB HID device on usb-0000:00:14
 SUBSYSTEM=hid
 DEVICE=+hid:0003
The first field in the kernel message is again the PRI. This follows the same numbering as the syslog RFCs but it's not in angular brackets this time. In this case it's facility 0 (the kernel) and severity 6 (info). The second field is the KSEQ. This is a number that counts up for every log message since boot. The logbookd implementation uses this to de-duplicate the kernel log messages after opening the file since it will always return the old kernel log messages first.
After that comes the timestamp. Instead of string parsing this is a straight up unix timestamp so it's way easier to deal with. The field after the timestamp is - indicating NULL, this is the flags field.
After the semicolon the actual kernel log message starts. This is the message as is rendered in the dmesg utility. After the log message there's a newline but the log line doesn't end there! The structured data is defined as indented continuation lines after the message itself and this contains some easier machine-parsable data that is usually hidden in dmesg.
Systemd journald
So everything changed when journald was introduced. Figuring out how this all works involves diving into the systemd source code. Systemd provides several unix sockets related to logging in /var/run/systemd/journal:
dev-logthis is symlinked to/dev/logand receives syslog formatted lines and writes it to the journalstdoutis a socket that receives logs from systemd units. This is what thesystemd-catcommand connects to. It writes a header on connection to give the application metadata and then the stdout or stderr is just connected straight to this socket.socketreceives the log messages in the binary journald format
There is a few other fancy things that journald does. It is possible to filter your log messages with the --boot argument. If no argument is supplied it will only show messages from the current boot. If you specify a negative number it's possible to get only log messages from a specific previous bootup.
The way this is done is by reading from /proc/sys/kernel/random/boot_id. This is a value generated by the kernel on bootup. It is a UUID generated from random data. These are also the values you see when you run journalctl --list-boots. The BOOT_ID value shown there is this UUID with the dashes removed.
My logbookd implementation also reads the boot_id on startup and stores it with the logs, this allows filtering in the exact same way with the logread -b parameter.
Logging to a database
So the main departure journald and logbookd do from the older syslog daemons is that they don't log to plain-text files. Journald has a custom database format the messages are stored in and logbookd stores messages in an SQLite database.
Structured logging to a database has a few nice upsides. The main one is being able to do way more detailed filtering than what is reasonably possible with grep. It's a lot easier to filter on a specific date and time range in a database and due to database indexes this is still fast.
One of the other main reasons for using SQLite in logbookd is that the implementation in postmarketOS was configured to only log to memory. Using SQLite as logging back-end meant that it's easily possible to replicate this by writing to an in-memory database which is already supported by SQLite.
The final thing added to logbookd is the middle ground between in-memory and on-disk logging: the reduced writes mode. In this mode the syslog is written to an in-memory database but when receiving a SIGINT, SIGTERM or SIGUSR1 signal the logbookd daemon will open the on-disk database and lets SQLite do a database migration. This means that SQLite will append the write the new loglines to the disk without rewriting all the existing logs there. On bootup this database is restored again so the logging system behaves as-if it's configured to do normal on-disk logging.
You can use this now
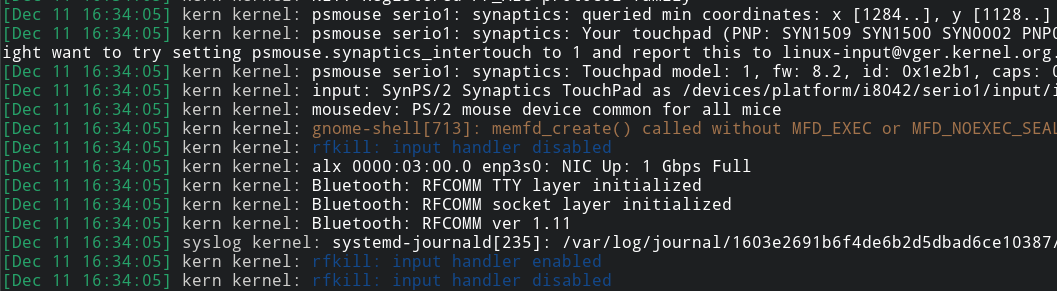
If you're running postmarketOS edge and you have updated to the latest version your installation should've migrated to the logbookd logging daemon. The logread utility implements the common options the busybox logread command already had. For normal use this means that there's not much difference except that the log output from the logread utility is now colored and contains kernel logs.
Some examples of the new things that are now possible:
$ logread -b list
ID   BOOT ID                                FIRST ENTRY       LAST ENTRY
 0   05c3f283-3bae-4b2a-8431-210dd63310e0   Dec 11 16:33:59   Dec 11 16:34:05
-1   f3ea2fa1-6f9e-4e82-bd0b-201091fcb5b4   Dec 07 18:21:06   Dec 07 18:25:50

$ logread -b 0 -n 2
[Dec 11 16:35:09] daemon dleyna-renderer-service[18060]: Client :1.166 lost
[Dec 11 16:35:10] daemon dleyna-renderer-service[18060]: dLeyna: Exit

$ logread -b 1 -n 1
[Dec 07 18:25:18] kern kernel: perf: interrupt took too long (2531 > 2500), lowering kernel.perf_event_max_sample_rate to 79000

$ logread -b -1 -u logbookd -n 1
[Dec 07 18:25:37] syslog logbookd: Ready to process log messages
Being able to see interleaved kernel and userspace messages also makes certain scenarios a lot easier to debug.
Hopefully this makes a few things easier to debug. There's a bunch of software that also logs directly into /var/log in seperate files, this has not been replaced by logbookd and is also not directly query-able by this new system. For the rest of the log messages enjoy the new colors :)