Everyone that has tried to make some nice charts in Grafana has probably come across timeseries databases, for example InfluxDB or Prometheus. I've deployed a few instances of these things for various tasks and I've always been annoyed by how they work. But this is a consequence of having great performance right?
The thing is... most the dataseries I'm working with don't need that level of performance. If you're just logging the power delivered by a solar inverter to a raspberry pi then you don't need a datastore for 1000 datapoints per second. My experience with timeseries is not that performance is my issue but the queries I want to do which seem very simple are practically impossible, especially when combinated with Grafana.
Something like having a daily total of a measurement as a bar graph to have some long-term history with keeping the bars aligned to the day boundary instead of 24 hour offsets based on my current time. Or being able to actually query the data from a single month to get a total instead of querying chunks of 30.5 days.
But most importantly, writing software is fun and I want to write something that does this for me. Not everything has to scale to every usecase from a single raspberry pi to a list of fortune 500 company logos on your homepage.
A prototype
Since I don't care about high performance and I want to prototype quickly I started with a Python Flask application. This is mainly because I already wrote a bunch of Python glue before to pump the data from my MQTT broker into InfluxDB or Prometheus so I can just directly integrate that.
I decided that as storage backend just using a SQLite database will be fine and to integrate with Grafana I'll just implement the relevant parts of the Prometheus API and query language.
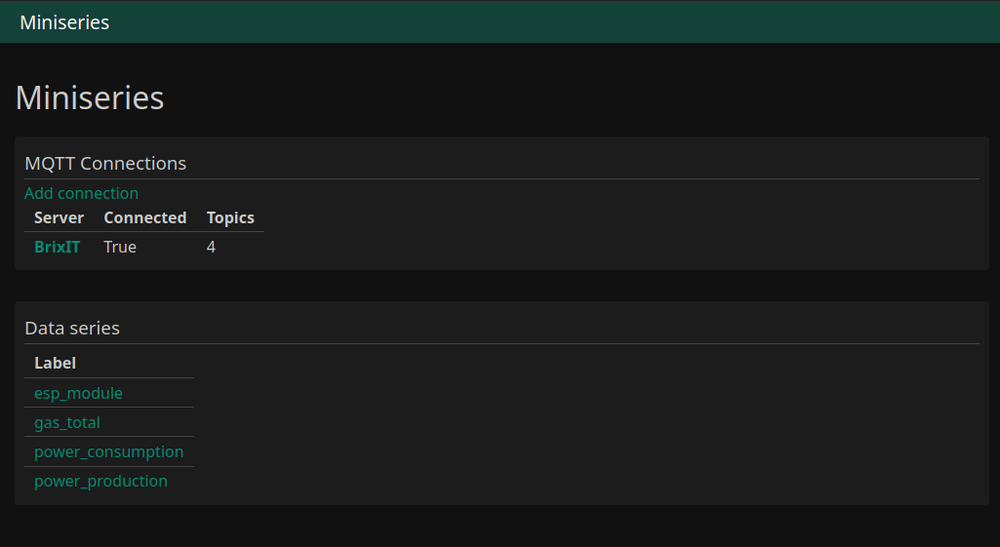
To complete it I made a small web UI for configuring and monitoring the whole thing. Mainly to make it easy to adjust the MQTT topic mapping without editing config files and restarting the server.

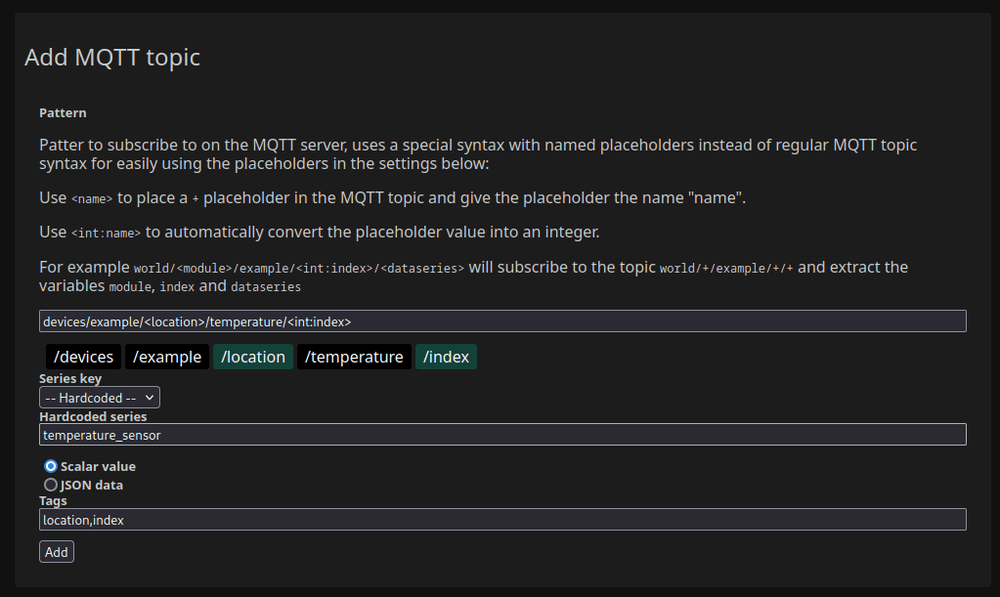
I've honestly probably spend way too much time writing random javascript for the MQTT configuration window. I had already written a MQTT library for Flask that allows using the Flask route syntax to extract data from the topic so I reused that backend. To make that work nicely I also wrote a simple parser for the syntax in Javascript to visualize the parsing while you type and give you dropdowns for selecting the values.

This is not at all related to the dataseries part but at least it allows me to easily get a bunch of data into my test environment while writing the rest of the code.
The database
For storing the data I'm using the sqlite3 module in Python. I dynamically generate a schema based on the data that's coming in with one table per measurement.
There's two kinds of devices on my MQTT broker, some send the data as a JSON blob and some just send single values to various topics.

The JSON blobs are still considered a single measurement and all the top-level values get stored in seperate columns. Later in the querying stage the specific column is selected.
My worst case is a bunch of ESP devices that measure various unrelated things and output JSON to the topic shown above with JSON. I have a single ingestion rule in my database that grabs devices/hoofdweg/ and dumps it in a table that has the columns for the various sensors, which ends up with a schema like this:

A timestamp is stored, no consideration is made for timezones since in practically all cases a house isn't located right on a timezone boundary. The tags are stored in seperate columns with a tag_ prefix and the fields are stored in column with a field_ prefix. The maximum granularity of data is also a single second since I don't store the timestamp as a float.
A lot of the queries I do don't need every single datapoint though but instead I just need hourly, daily or monthly data. For that a second table is created with the same structure but with aggregated data:

This contains a row for every hour with the min(), max() and avg() of every field, it also contains a row for every day and one for every month. This makes it possible to after a preconfigured amount of time just throw away the data that has single-second granularity and keep the aggregated data way longer. For querying you explicitly select which table you want the data from.
The querying
To make the Grafana UI not complain too much I kept the language syntax the same as Prometheus but simply implemented less of the features because I don't use most of them. The supported features right now are:
- Simple math queries like
1+1, this can only do addition queries and is only here to satisfy the Grafana connection tester. - Selecting a single measurement from the database and filtering on tags using the braces like
my_sensors{sensor="solar"} - Selecting a time granularity with brackets like
example_sensor[1h]. This only supports1h,1dand1Mand selects which rows are queried - The aggregate functions like
max(my_sensors[1h])which makes it select the columns from the reduced table with themax_prefix for querying when using the reduced table. For selecting the realtime data it will use the SQLitemax()function.
This is also just about enough to make the graphical query builder in Grafana work for most cases. The other setting used for the queries is the step value that Grafana calculates and passes to the Prometheus API. For the reduced table this is completely ignored and for the realtime table this is converted to SQL to do aggregation across rows.
As an example the query avg(sensors{sensor="solar", _col="voltage"}) gets translated to:
SELECT
  instant,
  tag_sensor,
  avg(field_voltage) as field_voltage
FROM series_sensors
WHERE instant BETWEEN ? AND ? -- Grafana time range
  AND tag_sensor = ? -- solar
GROUP BY instant/30 -- 30 is the step value from Grafana
To get nice aligned hourly data for a bar chart the query simply changes to avg(sensors{sensor="solar", _col="voltage"}[1h]) which generates this query:
SELECT
  instant,
  date,
  hour,
  tag_sensor,
  avg_voltage
FROM reduced_sensors
WHERE instant BETWEEN ? AND ? -- Grafana time range
  AND tag_sensor = ? -- solar
  AND scale = 0 -- hourly
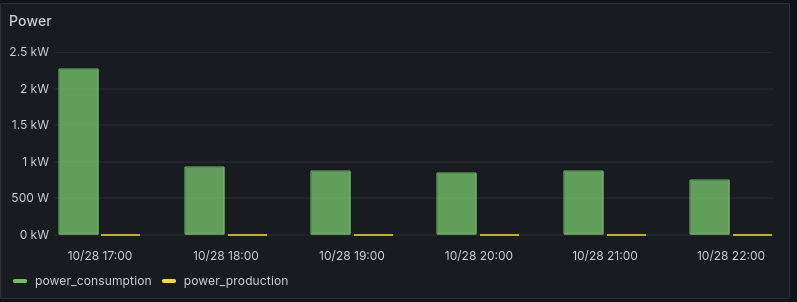
This reduced data is generated as background task in the server and makes sure that the row with the aggregate of a single hour selects the datapoints that fit exactly in that hour, not shifted by the local time when querying like I now have issues with in Grafana:

The bars in this chart don't align with the dates because this screenshot wasn't made at midnight. The data in the bars is also only technically correct when viewing the Grafana dashboard at midnight since on other hours it selects data from other days as well. If I view this at 13:00 then I get the data from 13:00 the day before to today which is a bit annoying in most cases and useless in the case of this chart because the daily_total metric in my solar inverter is reset at night and I pick the highest value.
For monthly bars this issue gets worse because it's apparently impossible to accurately get monthly data from the timeseries databases I've used. Because I'm pregenerating this data instead of using magic intervals this also Just Works(tm) in my implementation.

Is this better?
It is certainly in the prototype stage and has not had enough testing to find weird edgecases. It does provide all the features though I need to recreate by existing home automation dashboard and performance is absolutely fine. The next step here is to implement a feature to lie to Grafana about the date of the data to actually use the heatmap chart to show data from multiple days as multiple rows.
Once the kinks are worked out in this prototype it's probably a good idea to rewrite it into something like Go for example because while a lot of the data processing is done in SQLite the first bottleneck will probably be the single-threaded nature of the webserver and the MQTT ingestion code.
The source code is online at https://git.sr.ht/~martijnbraam/miniseries

